-
Home
-
Product
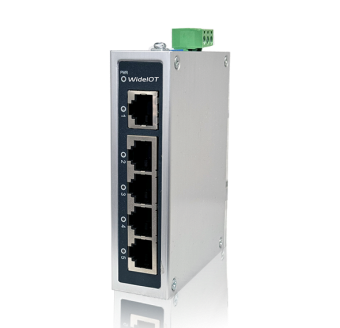
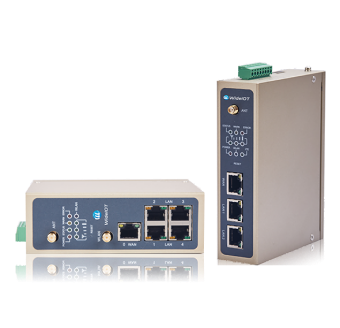
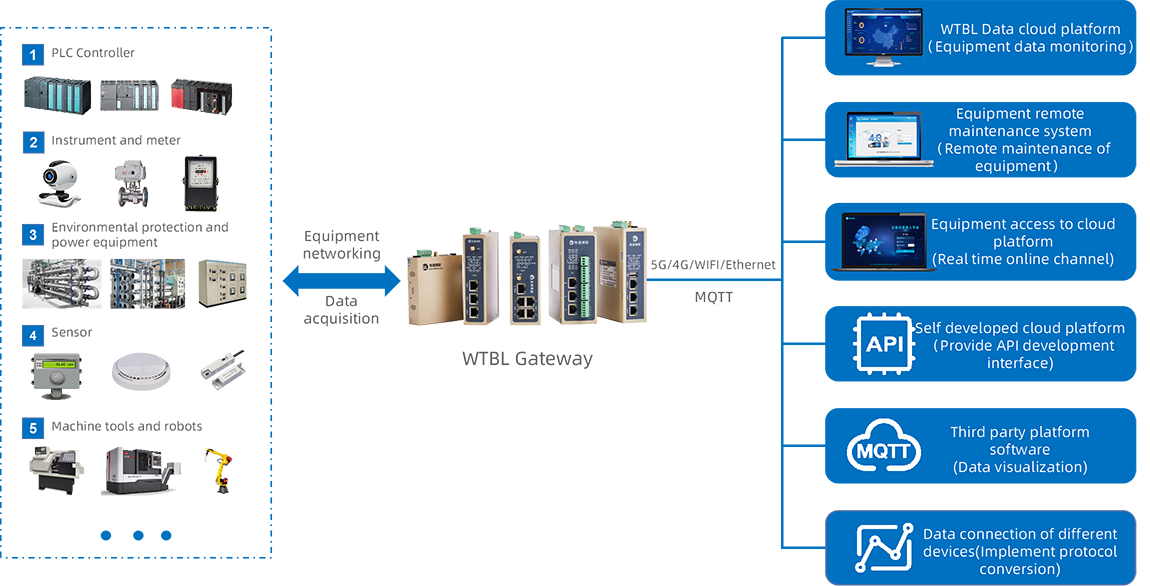
ProductIndustrial GateWay IOT Terminals Industrial Router Industrial Switches NAT Coupler IOT Data Platform Equipment Remote Maintenance System Equipment Remote Access Platform WideIOT · WG series industrial intelligent gateway is a high reliability industrial intelligent gateway that supports the collection of data of various industrial equipment such as PLC, instrument, water environmental protection, power equipment, CNC, and has protocol analysis and edge computing. It is the core edge node for building industrial Internet system.View details>
 -
Industries
IndustriesFactory Digitalization Equipment Digitalization Energy Digitalization Vehicle Digitalization Smart Water Conservancy Smart Agri-Husbandry Smart City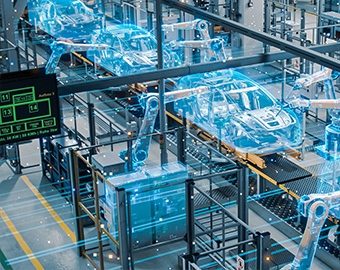 WideIOT focuses on common aspects in factories such as production line IoT and data collection, equipment operation management, energy consumption analysis and control, production safety monitoring, and environmental protection monitoring. Through the application of advanced technologies like the Internet of Things (IoT) and big data, it provides enterprises with one-stop digital solutions for smart factories, including equipment networking, data collection, data standardization, data monitoring, and data application. These solutions improve the digitalization and intelligentization level of factories, promoting the transformation, upgrading, and sustainable development of manufacturing enterprises.View details>Production Line IoT & Data CollectionEquipment Operation ManagementEnergy Consumption Analysis & ControlProduction Safety MonitoringFactory Environmental Protection MonitoringEquipment Network Isolation
 -
Solution
SolutionSmart Factory Intelligent Equipment Hydraulic Engineering Energy & Electricity Water Services Environmental Protection Agriculture & Livestock Smart City Smart Vehicles WideIOT focuses on common factory needs such as production line IoT integration and data acquisition, equipment operation management, energy consumption analysis and control, production safety monitoring, and environmental monitoring. By leveraging advanced technologies like IoT and big data, we provide enterprises with one-stop smart factory solutions encompassing equipment networking, data collection, data standardization, data monitoring, and data application. We elevate factories' digitalization and intelligence levels, driving the transformation, upgrading, and sustainable development of manufacturing enterprises!View details>
 -
About Us
About Us WideIOT, founded in 2011, is a professional provider of industrial Internet of Things products and industrial digital solutions. WideIOT focuses on providing industrial intelligent gateway, industrial data acquisition terminal, equipment remote maintenance management system, industrial equipment data cloud platform and other products and solutions for equipment manufacturers, intelligent factories, industrial projects and other fields, to help customers achieve digital operation management and industrial Internet new value mining. WideIOT's products are widely used in intelligent factories, equipment manufacturers, environmental protection industry, energy industry, municipal engineering, industrial automation, smart agriculture, building intelligence and other industrial fields.View details>
 -
Service Support
Service Support -
Contact Us


